Peer evaluation that shows who needs your attention
Your students rate their teammates from the phone or the computer. You see each team's cohesion, engagement and at-risk students, project after project, in time to act before disengagement becomes dropout.
What do you want to see in your class?
No credit card ✦ Free for teachers, up to 20 students
From the class list to the first results, in three steps
-
1
Create the course and bring in your class
Import teams and students from a spreadsheet. Each student gets an email invitation to set a password.
-
2
Students evaluate their teammates
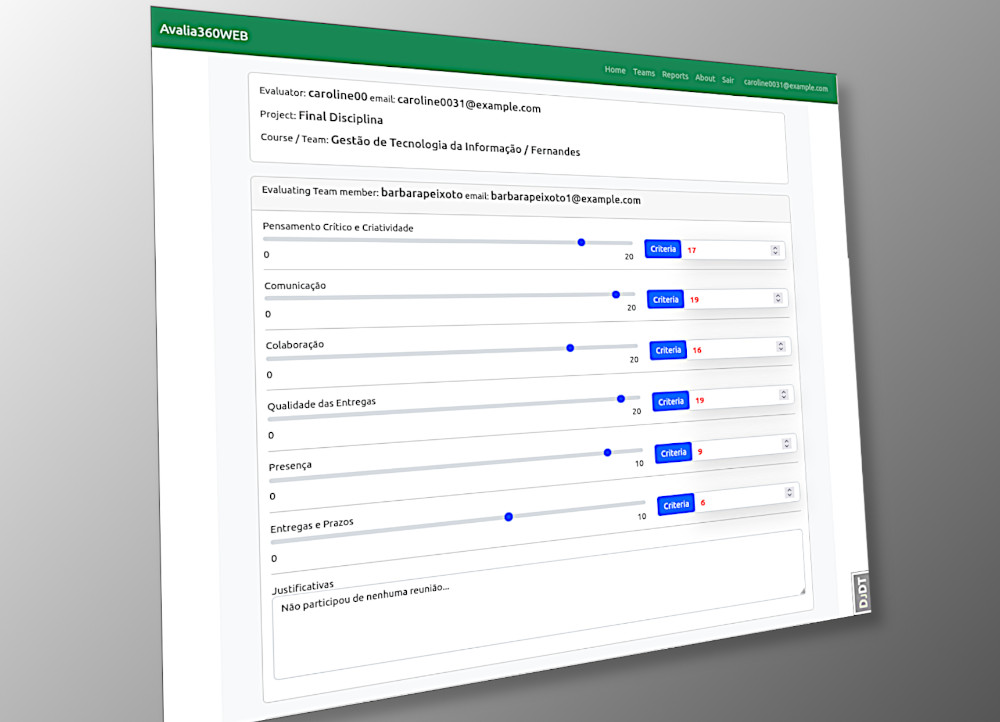
On the phone or the computer, each student rates every teammate on the questionnaire's dimensions and can say why.
-
3
You see who needs attention
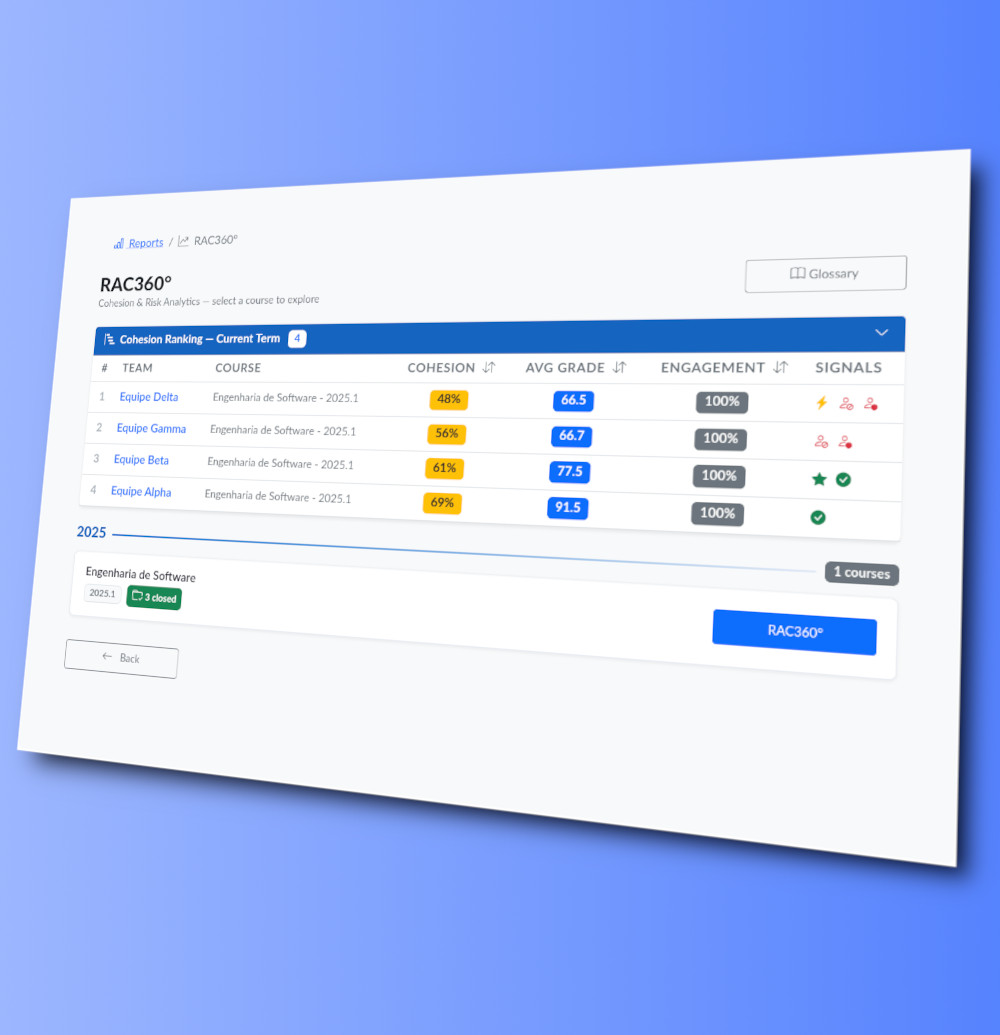
Grades are calculated automatically. RAC360, Trends and XRay show each team's cohesion and the students at risk.
Three tools to catch students before they fall
From peer evaluation to early intervention — the retention analytics universities actually need.
RAC360° Report
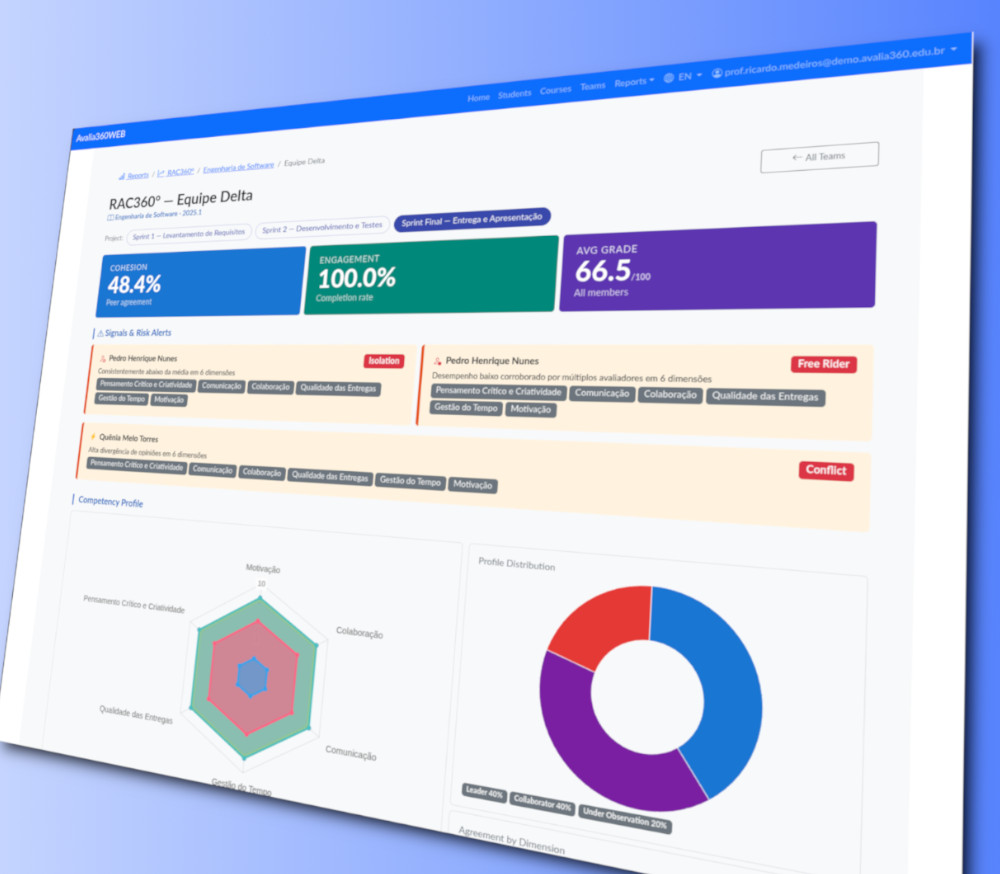
A cohesion & risk report per team. A Cohesion Index, engagement score and Z-score classify every student into four archetypes — including an At-Risk signal for those consistently rated below their peers.
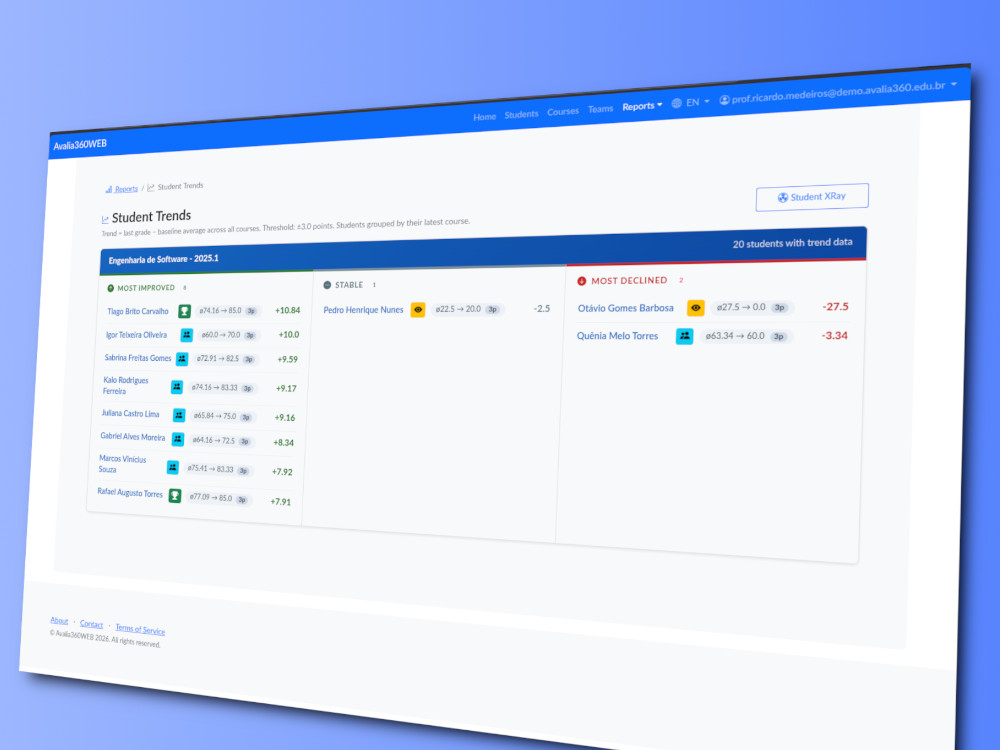
Student Trends
Every student's trajectory across the whole semester. See grades and engagement trending up, flat or down — and spot the decline before the term ends.
Student XRay
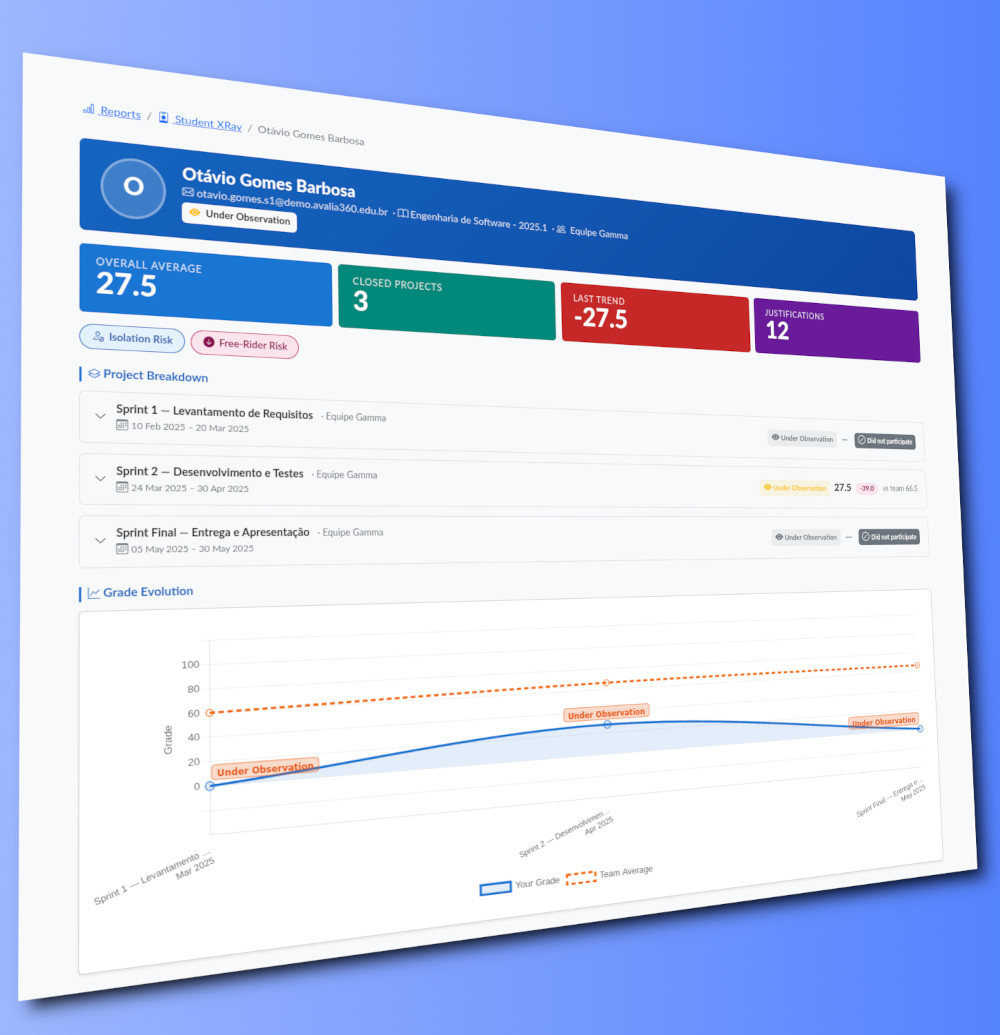
A per-student deep dive: dimension breakdown, RAC archetype and risk flags, grade evolution, and word clouds from peer justifications.
See which students the team is quietly leaving behind
From the same peer evaluations your students already complete, RAC360° builds a cohesion-and-risk picture of each team — and flags the members at risk of disengaging.
- Cohesion Index — how much peers agree; low cohesion exposes friction and uneven contribution.
- Z-score & At-Risk archetype — students rated well below the team mean are surfaced automatically — disengaged, struggling, or excluded.
- Engagement score — who is actually participating versus coasting, per project.
Catch the decline while there is still time to act
Student Trends tracks every student across all of a course's projects, so a downward trajectory shows up weeks before it becomes a withdrawal.
- Up / flat / down trend for each student over the semester.
- Grouped by course, so coordinators see a whole cohort at a glance.
- Turns scattered project grades into one early-warning signal.
Everything you need before the conversation
When a student is flagged, XRay gives the advisor the full picture on one screen — so the intervention is informed, specific, and human.
- Per-dimension breakdown and RAC archetype with risk flags.
- Grade evolution project by project.
- Word clouds from peers' written justifications — the why behind the score.
One platform, two very different jobs
Teachers and coordinators get the retention picture. Students get feedback they can actually use — which is why they keep answering.
See the whole cohort
Every course, team and project in one list — with cohesion, engagement and dropout flags already computed. No spreadsheets.
Zoom into one student
Dimension breakdown, RAC archetype, risk flags and grade trajectory — the evidence behind the flag, on one screen.
Walk in prepared
A printable intervention report per student, ready for the advising conversation — one student or the whole watch list at once.
Feedback on six dimensions
Not one grade — a profile. See how your teammates rated you on each dimension, project after project.
- Critical Thinking & Creativity
- Communication
- Collaboration
- Quality of Deliverables
- Presence
- Deliverables & Deadlines
Badges for the habits that count
Answering on time, evaluating every teammate, keeping it up all semester — the invisible work becomes visible.
- On-Time Submitter
- High Achiever
- Perfect Evaluator
- Rapid Fire
- Unstoppable
Your own evolution
Your grades and dimensions project by project, so you can see what improved and what still needs work — while the semester is still running.
Coming next: development tracks that turn your profile into the soft skills worth working on.
Are you a student? You join through your teacher's invitation.
Sign in to your accountStart with your course. Bring in the whole institution when you are ready.
Free
Everything you need to run peer evaluation in your courses.
- Up to 20 students and 4 teams
- 1 course and 1 active project at a time
- RAC360, Trends and XRay for your courses
- Email invitations for your students
Institutions
The coordination sees every course, and our team sets it up with you.
- Coordination with an institution-wide view
- Intervention reports for advising
- Bulk import of students and teams
- Onboarding, support and an LGPD data processing agreement
Frequently asked questions
How do students get access?
Each student receives an email invitation to set a password. There is nothing to install: Avalia360 runs in the browser, on the phone or the computer.
What do students answer?
A ready-made questionnaire: each student rates every teammate on six dimensions (critical thinking and creativity, communication, collaboration, quality of deliverables, presence, and deliverables and deadlines) and can explain the rating.
How is the grade calculated?
From the ratings each student receives from the teammates, dimension by dimension. Avalia360 calculates the grades by itself and shows them next to the team and course averages.
Who sees the results?
The course's teachers see the reports. Each student sees their own grades and the evaluations they received. With the institutional plan, the coordination sees the whole institution.
How much does it cost?
It is free for teachers: 1 course at a time, up to 4 teams and 20 students. The coordination, the institution-wide view and our institutional services are in the institutional plan: talk to us.
What about the students' data (LGPD)?
Each institution only sees its own data, and access to the students' personal data is logged. Read the Terms of Service.
Try it in your next course
Create your account, bring in your class and open the first evaluation.